Wednesday, 2013-02-20 T 20:00:00Z
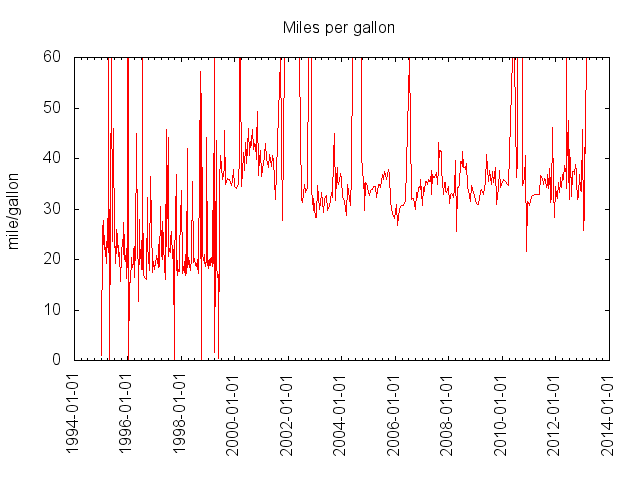
Q: So why the wildly varying mile/gallon?
A: I think it's errors in the source data. For example, if I forget to enter the numbers from one fillup, then the next fillup appears to have covered roughly double the miles, thereby roughly doubling the mile/gallon. I guess I could have fat-fingered the occasional entery. It's also possible that my graphs are confused by multiple fillups in a single day as happens on a road trip. (HOwever, I haven't done a road trip in my own car for years, so that doesn't explain the incorrect mile/gallon in 2012.